


The client is a leading outdoor tourism and eco-tour operator in Florida, specializing in guided kayak tours, paddleboard rentals, and coastal recreational experiences. Their primary business model relies on capturing high-intent tourist traffic and converting online searchers directly into direct website bookings.
The operation serves thousands of local and visiting adventure seekers annually. Operating in a highly seasonal coastal market, the firm required an agile paid search infrastructure capable of capturing surge tourist demand during winter holiday peaks while maintaining lean acquisition costs during shoulder months
When Expresso Company assumed management of the client's Google Ads account, the business was struggling with severe ad spend inefficiencies and aggressive third-party platform competition:
To eliminate ad waste and establish direct booking dominance, Expresso Company executed a three-phase PPC restructuring framework:
Through proactive campaign management, Expresso Company converted $78,393.92 in ad spend into $201,828.59 in direct booking revenue, achieving an average return on ad spend (ROAS) of 257%.
| Metric | Legacy Agency Baseline | Expresso Company Performance | Impact / Growth |
|---|---|---|---|
| Total Direct Revenue | $99.8K (Prior Period) | $201,828.59 | +$102K YoY Surge (+102.5%) |
| Total Direct Bookings | 722 (Prior Period) | 1,463 Bookings | +102.5% Booking Growth |
| Average ROAS | <150% Avg | 257% Avg (Peak 555%) | Strong Profit Margins |
| Average Cost Per Click | $4.50+ Highs | $2.04 Avg ($1.43 Low) | -54.6% Reduction in CPC |
Stabilized acquisition costs and eliminated legacy agency waste.
Captured holiday travel demand, driving over $38K in December alone.
Lowered spend while unlocking a record 555% ROAS in February.
| Month | Clicks | Total Spend ($) | Avg CPC ($) | Conversions | Direct Revenue ($) | ROAS |
|---|---|---|---|---|---|---|
| July 2025 | 2,938 | $6,762.08 | $2.30 | 118.86 | $17,647.72 | 261% |
| August 2025 | 2,456 | $5,469.69 | $2.23 | 99.59 | $12,511.74 | 229% |
| September 2025 | 1,692 | $3,711.42 | $2.19 | 70.15 | $9,052.81 | 244% |
| October 2025 | 2,553 | $6,072.75 | $2.38 | 93.13 | $11,512.85 | 190% |
| November 2025 | 2,966 | $7,600.43 | $2.56 | 124.60 | $19,212.09 | 253% |
| December 2025 | 4,311 | $11,433.26 | $2.65 | 217.20 | $37,996.53 | 332% |
| January 2026 | 4,256 | $9,467.97 | $2.22 | 157.38 | $22,849.85 | 241% |
| February 2026 | 3,156 | $5,595.16 | $1.77 | 177.36 | $31,035.92 | 555% |
| March 2026 | 4,439 | $7,547.66 | $1.70 | 111.62 | $21,176.78 | 281% |
| April 2026 | 3,038 | $4,347.42 | $1.43 | 82.27 | $12,479.14 | 287% |
| May 2026 | 3,269 | $6,835.50 | $2.09 | 117.15 | $18,913.99 | 277% |
| June 2026 | 3,275 | $7,600.58 | $2.32 | 94.49 | $17,439.17 | 229% |
| 12-Month Total | 38,349 | $78,393.92 | $2.04 (Avg) | 1,463.80 | $201,828.59 | 257% |
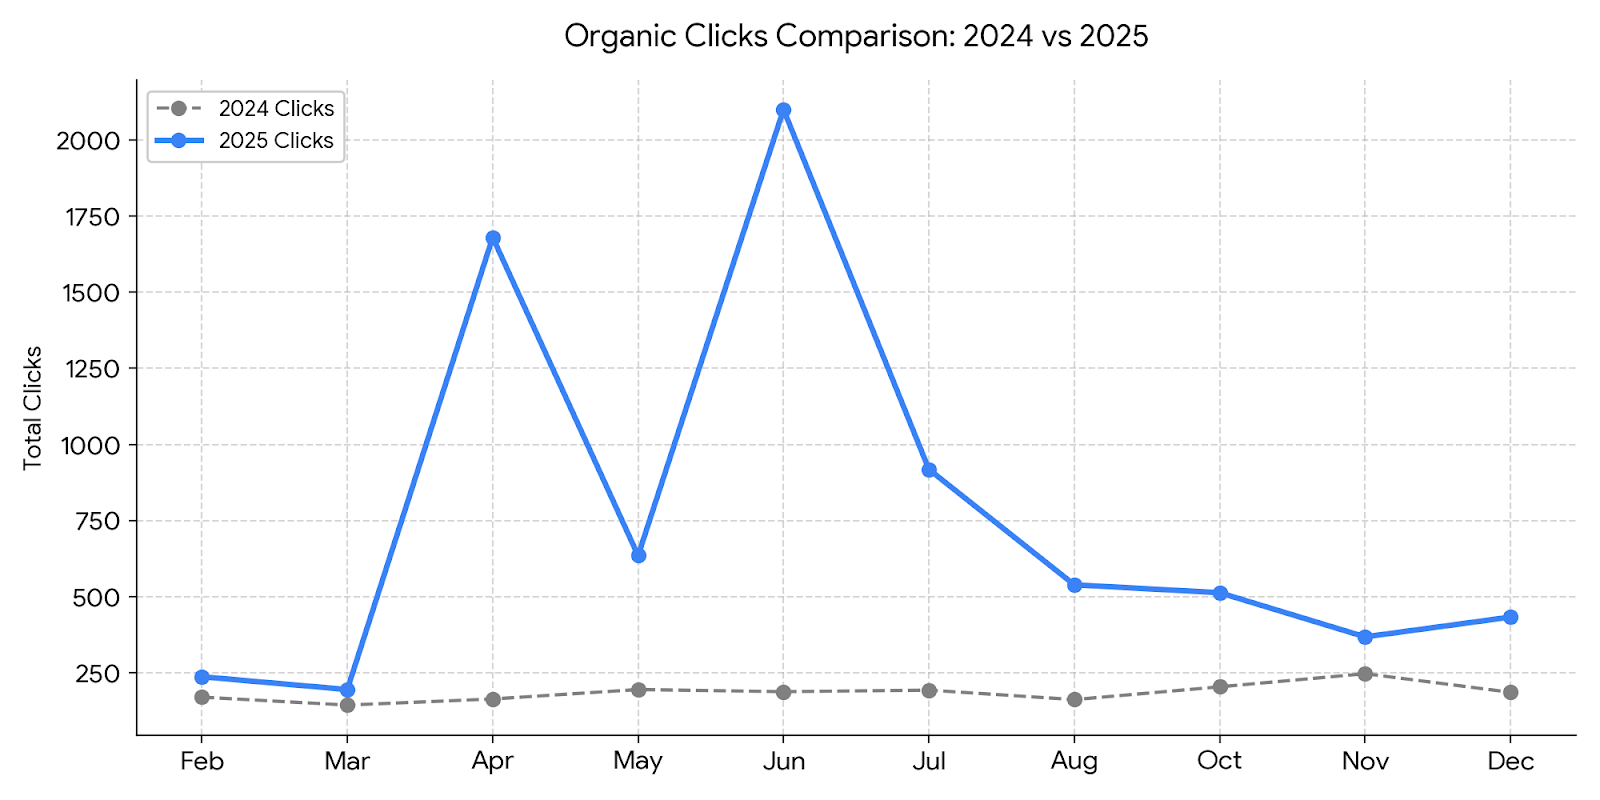
Comparing the 5-month spring period (Feb-Jun) year-over-year, direct revenue doubled from $49.8k to $101k+ while ad spend remained flat (+4.4%).
Captured surge tourism in December 2025, producing $37,996.53 in revenue at a 332% ROAS.
Reached a peak 555% ROAS in February 2026, generating over $31k in direct bookings on under $5.6k in ad spend.
Reduced average CPC from previous agency highs of $4.50+ down to $1.43-$1.77, driving over 38,000 qualified visitors directly into the booking engine.
By replacing static, unmonitored bidding with a proactive, season-adjusted Google Ads structure, Expresso Company reclaimed the client's direct booking market share. We transformed an unoptimized PPC campaign into a high-yield revenue engine that bypassed Online Travel Agency commission fees, doubled direct revenue YoY, and delivered sustainable 257% profit margins.
In a competitive, high-seasonality market, precision keyword suppression combined with dynamic budget scaling is the most effective framework for securing direct customer acquisition.
We did not just run ad campaigns; we built a sustainable direct-revenue engine that protects profit margins and scales automatically with market demand.
Stop paying high commissions to third-party directories and wasting ad budget on non-converting search terms. Partner with Expresso Company to build a high-ROI, predictable paid acquisition engine built specifically for your business.

